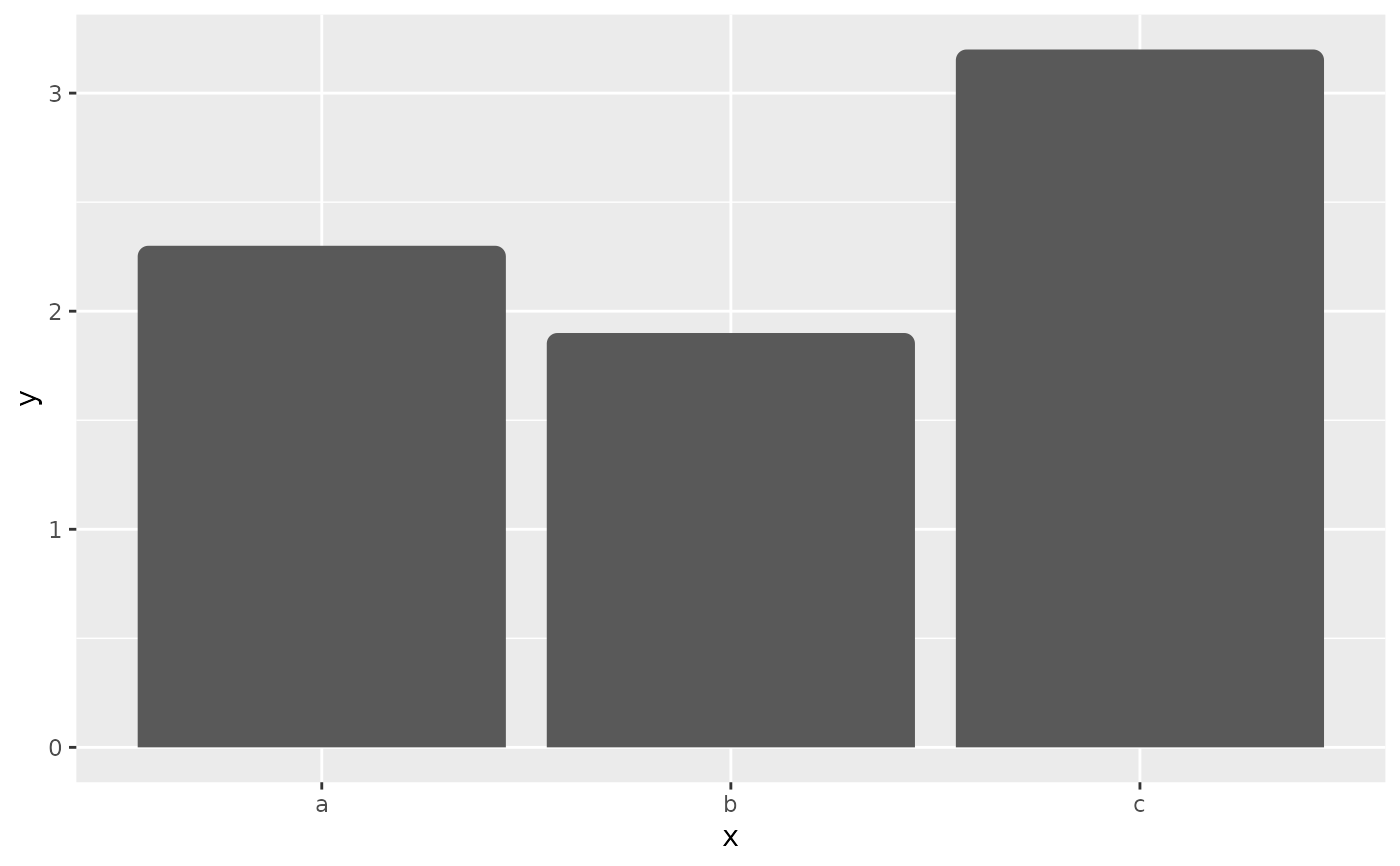
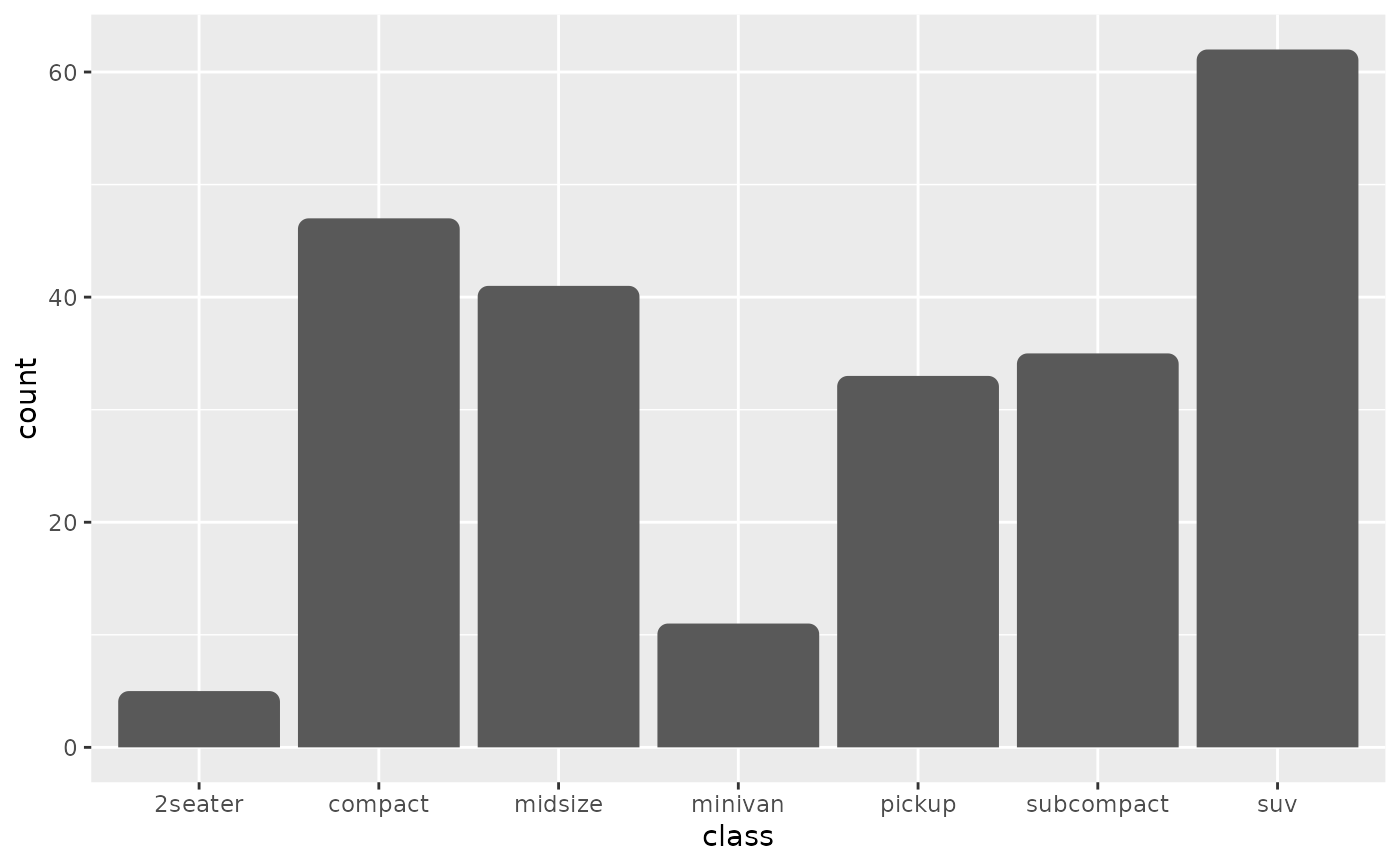
Bar plot with rounded corners
Source:R/geom-bar-rounded.R, R/geom-col-rounded.R
geom_col_rounded.RdCreate a bar plot with rounded corners using
'ggplot2'. geom_col_rounded() and geom_bar_rounded() are extensions of
the ggplot2::geom_col() and ggplot2::geom_bar() functions and they
provide additional aesthetics for more visually appealing outputs.
Usage
geom_bar_rounded(
  mapping = NULL,
  data = NULL,
  position = ggplot2::position_stack(reverse = TRUE),
  radius = 0.2,
  ...,
  width = NULL,
  na.rm = FALSE,
  show.legend = NA,
  inherit.aes = TRUE
)

geom_col_rounded(
  mapping = NULL,
  data = NULL,
  position = ggplot2::position_stack(reverse = TRUE),
  radius = 0.2,
  ...,
  width = NULL,
  na.rm = FALSE,
  show.legend = NA,
  inherit.aes = TRUE
)
Arguments
- mapping
Set of aesthetic mappings created by
ggplot2::aes(). If specified andinherit.aes = TRUE(the default), it is combined with the default mapping at the top level of the plot. You must supplymappingif there is no plot mapping.- data
The data to be displayed in this layer. There are three options:
If
NULL, the default, the data is inherited from the plot data as specified in the call toggplot2::ggplot().A
data.frame, or other object, will override the plot data. All objects will be fortified to produce a data frame. Seeggplot2::fortify()for which variables will be created.A
functionwill be called with a single argument, the plot data. The return value must be adata.frame, and will be used as the layer data. Afunctioncan be created from aformula(e.g.~ head(.x, 10)).- position
Position adjustment, either as a string naming the adjustment (e.g.
"jitter"to useposition_jitter), or the result of a call to a position adjustment function. Use the latter if you need to change the settings of the adjustment.- radius
A normalized rounding amount between 0 and 1. Use
0for square corners and1for the maximum rounding each bar can safely support.- ...
Other arguments passed on to
ggplot2::layer(). These are often aesthetics, used to set an aesthetic to a fixed value, likecolour = "red"orsize = 3. They may also be parameters to the paired geom/stat.- width
Bar width. If not supplied, the default is to use the width of 90% of the resolution of the data.
- na.rm
If
FALSE, the default, missing values are removed with a warning. IfTRUE, missing values are silently removed.- show.legend
logical. Should this layer be included in the legends?
NA, the default, includes if any aesthetics are mapped.FALSEnever includes, andTRUEalways includes. It can also be a named logical vector to finely select the aesthetics to display.- inherit.aes
If
FALSE, overrides the default aesthetics, rather than combining with them. This is most useful for helper functions that define both data and aesthetics and shouldn't inherit behaviour from the default plot specification, e.g.ggplot2::borders().
Note
The code in this function was adapted from a solution provided by Stack Overflow user 'sthoch' in the following post: https://stackoverflow.com/questions/62176038/r-ggplot2-bar-chart-with-round-corners-on-top-of-bar