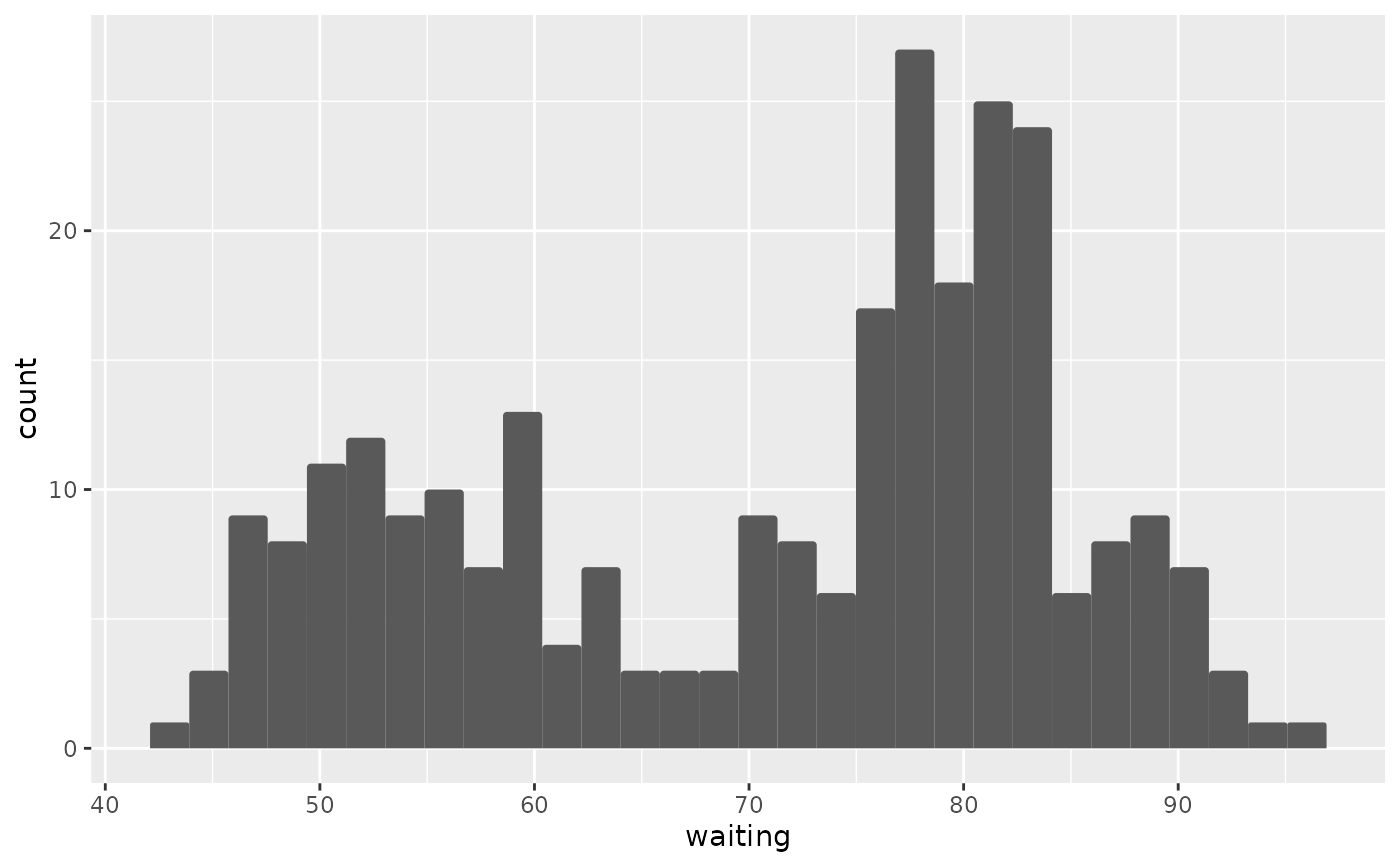
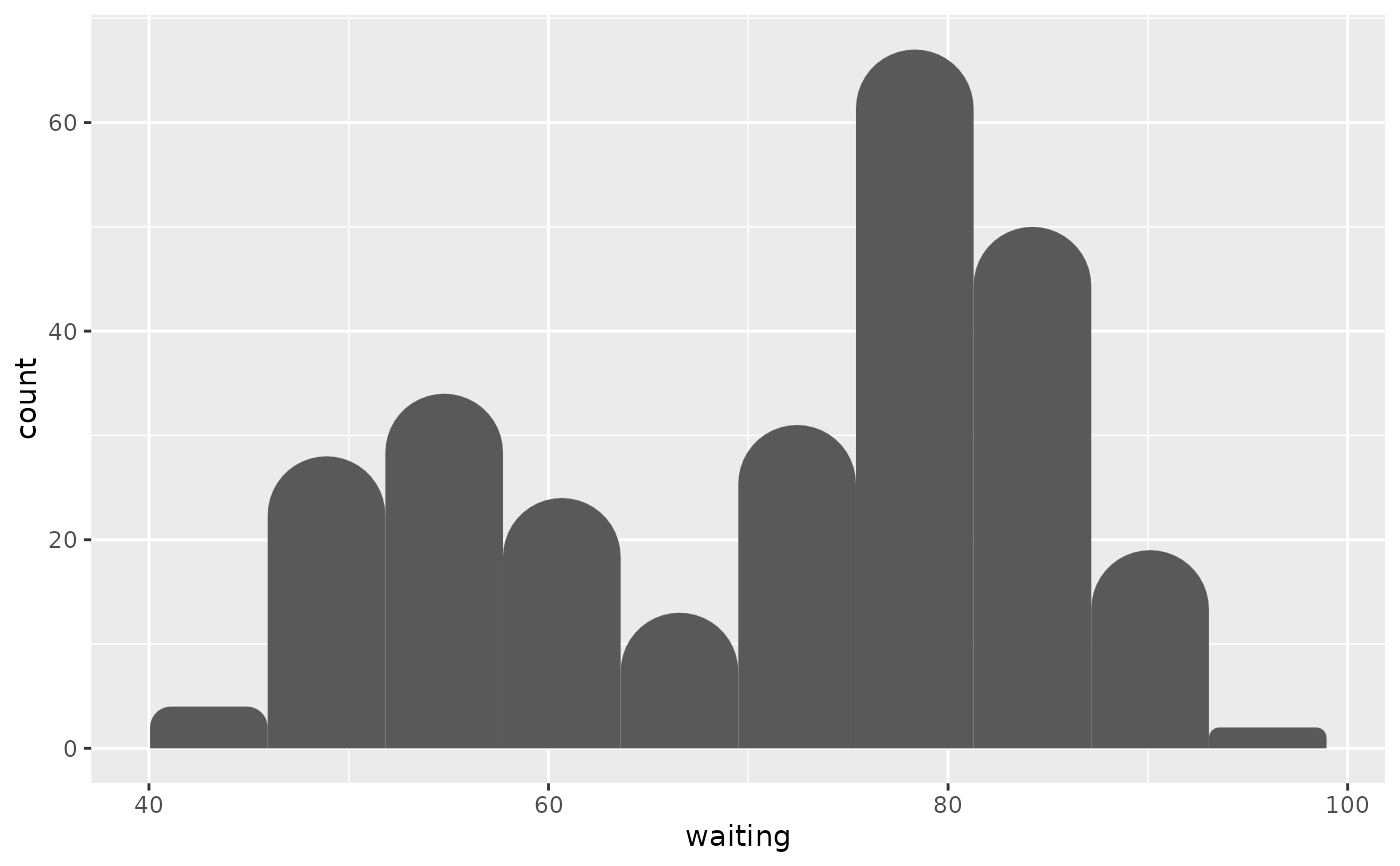
Create a histogram with rounded corners using
'ggplot2'. geom_histogram_rounded() is an extension of the
ggplot2::geom_histogram() function and uses the same binning
parameters as ggplot2::stat_bin() while drawing bars with rounded
corners.
Usage
geom_histogram_rounded(
  mapping = NULL,
  data = NULL,
  position = "stack",
  radius = 0.2,
  ...,
  binwidth = NULL,
  bins = NULL,
  center = NULL,
  boundary = NULL,
  closed = c("right", "left"),
  pad = FALSE,
  breaks = NULL,
  drop = "none",
  orientation = NA,
  na.rm = FALSE,
  show.legend = NA,
  inherit.aes = TRUE
)
Arguments
- mapping
Set of aesthetic mappings created by
ggplot2::aes(). If specified andinherit.aes = TRUE(the default), it is combined with the default mapping at the top level of the plot. You must supplymappingif there is no plot mapping.- data
The data to be displayed in this layer. There are three options:
If
NULL, the default, the data is inherited from the plot data as specified in the call toggplot2::ggplot().A
data.frame, or other object, will override the plot data. All objects will be fortified to produce a data frame. Seeggplot2::fortify()for which variables will be created.A
functionwill be called with a single argument, the plot data. The return value must be adata.frame, and will be used as the layer data. Afunctioncan be created from aformula(e.g.~ head(.x, 10)).- position
Position adjustment, either as a string naming the adjustment (e.g.
"jitter"to useposition_jitter), or the result of a call to a position adjustment function. Use the latter if you need to change the settings of the adjustment.- radius
A normalized rounding amount between 0 and 1. Use
0for square corners and1for the maximum rounding each bar can safely support.- ...
Other arguments passed on to
ggplot2::layer(). These are often aesthetics, used to set an aesthetic to a fixed value, likecolour = "red"orsize = 3. They may also be parameters to the paired geom/stat.- binwidth
The width of the bins. The default uses 30 bins that cover the range of the data. You should usually override this value, exploring multiple widths to find the best to illustrate the stories in your data.
- bins
Number of bins. Overridden by
binwidth. Defaults to 30.- center, boundary
Bin position specifiers passed to
ggplot2::stat_bin().- closed
One of
"right"or"left"indicating whether right or left edges of bins are included.- pad
If
TRUE, adds empty bins at either side of the range.- breaks
A numeric vector of bin boundaries.
- drop
Controls whether empty bins are dropped. Passed to
ggplot2::stat_bin().- orientation
The orientation of the layer. Passed to
ggplot2::stat_bin().- na.rm
If
FALSE, the default, missing values are removed with a warning. IfTRUE, missing values are silently removed.- show.legend
logical. Should this layer be included in the legends?
NA, the default, includes if any aesthetics are mapped.FALSEnever includes, andTRUEalways includes. It can also be a named logical vector to finely select the aesthetics to display.- inherit.aes
If
FALSE, overrides the default aesthetics, rather than combining with them. This is most useful for helper functions that define both data and aesthetics and shouldn't inherit behaviour from the default plot specification, e.g.ggplot2::borders().