1 Your First Shiny App
E1: Create an app that greets the user by name. You don’t know all the functions you need to do this yet, so I’ve included some lines of code below. Think about which lines you’ll use and then copy and paste them into the right place in a Shiny app.
tableOutput("mortgage")
output$greeting <- renderText({
  paste0("Hello ", input$name)
})
numericInput("age", "How old are you?", value = NA)
textInput("name", "What's your name?")
textOutput("greeting")
output$histogram <- renderPlot({
  hist(rnorm(1000))
}, res = 96)
Solution:
library(shiny)

ui <- fluidPage(
  textInput("name", "What's your name?"),
  textOutput("greeting")
)

server <- function(input, output, session) {
  output$greeting <- renderText({
    paste0("Hello ", input$name)
  })
}

shinyApp(ui, server)
E2: Suppose your friend wants to design an app that allows the user to set a number (x) between 1 and 50, and displays the result of multiplying this number by 5. This is their first attempt:
library(shiny)

ui <- fluidPage(
  sliderInput("x", label = "If x is", min = 1, max = 50, value = 30),
  "then x times 5 is",
  textOutput("product")
)

server <- function(input, output, session) {
  output$product <- renderText({
    x * 5
  })
}

shinyApp(ui, server)
But unfortunately it has an error:
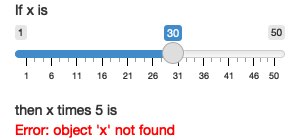
Can you help them find and correct the error?
Solution:
library(shiny)

ui <- fluidPage(
  sliderInput("x", label = "If x is", min = 1, max = 50, value = 30),
  "then x times 5 is",
  textOutput("product")
)

server <- function(input, output, session) {
  output$product <- renderText({
    input$x * 5
  })
}

shinyApp(ui, server)
E3: Extend the app from the previous exercise to allow the user to set the value of the multiplier, y, so that the app yields the value of x * y. The final result should look like this:
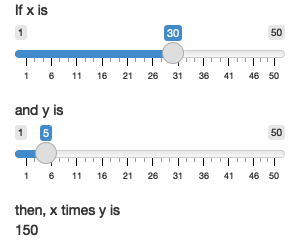
Solution:
library(shiny)

ui <- fluidPage(
  sliderInput("x", label = "If x is", min = 1, max = 50, value = 30),
  sliderInput("y", label = "and y is", min = 1, max = 50, value = 5),
  "then, x times y is",
  textOutput("product")
)

server <- function(input, output, session) {
  output$product <- renderText({
    input$x * input$y
  })
}

shinyApp(ui, server)
E4: Take the following app which adds some additional functionality to the last app described in the last exercise. What’s new? How could you reduce the amount of duplicated code in the app by using a reactive expression.
library(shiny)

ui <- fluidPage(
  sliderInput("x", "If x is", min = 1, max = 50, value = 30),
  sliderInput("y", "and y is", min = 1, max = 50, value = 5),
  "then, (x * y) is", textOutput("product"),
  "and, (x * y) + 5 is", textOutput("product_plus5"),
  "and (x * y) + 10 is", textOutput("product_plus10")
)

server <- function(input, output, session) {
  output$product <- renderText({
    product <- input$x * input$y
    product
  })
  output$product_plus5 <- renderText({
    product <- input$x * input$y
    product + 5
  })
  output$product_plus10 <- renderText({
    product <- input$x * input$y
    product + 10
  })
}

shinyApp(ui, server)
Solution:
library(shiny)

ui <- fluidPage(
  sliderInput("x", "If x is", min = 1, max = 50, value = 30),
  sliderInput("y", "and y is", min = 1, max = 50, value = 5),
  "then, (x * y) is", textOutput("product"),
  "and, (x * y) + 5 is", textOutput("product_plus5"),
  "and (x * y) + 10 is", textOutput("product_plus10")
)

server <- function(input, output, session) {
  product <- reactive(input$x * input$y)
  output$product <- renderText({ product() })
  output$product_plus5 <- renderText({ product + 5 })
  output$product_plus10 <- renderText({ product + 10 })
}

shinyApp(ui, server)
E5: The following app is very similar to one you’ve seen earlier in the chapter: you select a dataset from a package (this time we’re using the ggplot2 package) and the app prints out a summary and plot of the data. It also follows good practice and makes use of reactive expressions to avoid redundancy of code. However there are three bugs in the code provided below. Can you find and fix them?
library(shiny)
library(ggplot2)

datasets <- c("economics", "faithfuld", "seals")
ui <- fluidPage(
  selectInput("dataset", "Dataset", choices = datasets),
  verbatimTextOutput("summary"),
  tableOutput("plot")
)

server <- function(input, output, session) {
  dataset <- reactive({
    get(input$dataset, "package:ggplot2")
  })
  output$summmry <- renderPrint({
    summary(dataset())
  })
  output$plot <- renderPlot({
    plot(dataset)
  }, res = 96)
}

shinyApp(ui, server)
Solution:
library(shiny)
library(ggplot2)

datasets <- c("economics", "faithfuld", "seals")
ui <- fluidPage(
  selectInput("dataset", "Dataset", choices = datasets),
  verbatimTextOutput("summary"),
  plotOutput("plot")
)

server <- function(input, output, session) {
  dataset <- reactive({
    get(input$dataset, "package:ggplot2")
  })
  output$summary <- renderPrint({
    summary(dataset())
  })
  output$plot <- renderPlot({
    plot(dataset())
  }, res = 96)
}

shinyApp(ui, server)